Category Archives: Computers

Another simple example of an AI hallucination

Two readers noticed that the Kamehameha Day parade in 1957 was headed toward downtown past Kawaiahao Church, whereas the modern route begins at Iolani Palace and ends at Kapiolani Park.

I had earlier found a description of the 1957 parade route in a Honolulu Advertiser story at the time: “The parade will start at 10 a.m. from Atkinson Dr. and Kapiolani Blvd. It will continue on Kapiolani to King St., and wind up at Iolani Palace.”

That’s the reverse of the route used today.

But just for fun, I asked Google’s Gemini and ChatGPT what the route was in 1957. Both confidently returned completely incorrect answers. And when I told Gemini that it’s answer was wrong, it created and returned yet another wrong answer.

Here’s my exchange with Gemini.

Ian: What was the route of the Kamehameha Day parade in the 1950s?

Gemini: During the 1950s, the King Kamehameha Day Floral Parade in Honolulu followed the classic cross-town route connecting the historic civic center of downtown Honolulu to Queen Kapi?olani Park in Waikiki:

Formation & Start: Parade units staged in Downtown Honolulu around South King Street, Bishop Street, and Richards Street, assembling on and around the grounds of ?Iolani Palace and directly fronting the King Kamehameha statue at Aliiolani Hale.

Downtown to Waterfront: The procession moved along King Street and turned makai (toward the ocean) down Punchbowl Street, connecting onto Ala Moana Boulevard.

Waikiki Corridor: From Ala Moana Boulevard, the parade crossed over into Waikiki and turned onto Kalakaua Avenue.

Finish Line: Units marched the full length of Kalakaua Avenue through Waikiki before disbanding at Queen Kapiolani Park (typically near Monsarrat Avenue and the park bandstand), where the public hoolaulea, hula performances, and music festivities took place.

Ian: That answer is incorrect.

On my first time around with Google, it “corrected” itself to say that in 1957, the parade was confined to the downtown area, another wrong answer.

So I queried Gemini a second time. Equally incorrect.

Gemini: I stated the modern route instead of the historical 1950s route.

You are completely right, and I apologize for the generalized assumptions about the 1957 route.Historically, the King Kamehameha Day Parade layout underwent structural modifications over the decades. In 1957, the parade took place on Tuesday, June 11, 1957, and instead of a continuous trek straight down to Waikiki like modern iterations, it focused heavily on the historic core of downtown Honolulu.

The Core Path: The procession ran along King Street, specifically passing major historical waypoints like Kawaiahao Church and the King Kamehameha I Statue / Aliiolani Hale.

Once again, user beware!

Is it the end of dedicated photo apps?

I’m still here in the hospital with just my iPhone for passing the time. It has my books, my periodicals, my daily news, my online archives, and at least some of my photos. Oh, and it’s a phone, too!

So I’ve had some time to fool around with restoring old photos, some dating back more than 70 years.

There’s an example. The original, probably an early 1948, and the restored version done yesterday. The photo shows me as an infant with my older sister, Bonnie.

Normally, I would open the original old photo in Adobe, Lightroom or Photoshop on my laptop, and then make various tweaks to eliminate the visual age and fading of the photo. And I might come close to the results shown here after a tedious series of adjustments.

Instead, I copied the original 1948 version to ChatGPT, and then gave a simple series of verbal instructions.

I don’t have the exact sequence, but something like this.

“ restore vintage black-and-white photo. Adjust contrast and exposure. Slightly sharpen.”

This returned a very good, nearly finalized version of the restored photo. Then I directed it to straighten and crop to include only the photo, and then add a narrow white border around the photo.

At this point, photo purists would probably say I have destroyed the photo’s authenticity.

Perhaps, but how different is this from routine manual photo restoration?

I could, of course, have gone farther to add elements that aren’t actually there. Anything becomes possible when you go down this path, all via voice or written commands.

“Show the girl holding a kitten in her lap.”

Voila!

Spooky stuff!

Case Country isn’t where you think it is.
But Claude quickly got the picture.

My life change this morning. For the good. And, for regular readers-no, it’s nothing related to my current cancer treatment.

It’s the day after Hawaii’s Primary Election, and normally that involves my spending hours knee-deep in raw text files and legacy database queries.

But today was different. And that’s how the story begins.

In the past, my first task in the morning after an election, even before getting a cup of fresh coffee, would be to visit the Office of Elections’ website and quickly eyeball the tables of election data from the most recently available statewide summary of results. After a quick look through the outcomes of what were expected to be the most contested races, I would then download the text file containing raw precinct-level data also available from Office of Elections.

The next task would be to import the text file into Filemaker, a robust Mac database. My version is about five years old, but perfectly serviceable for my uses.

Once the data was downloaded into Filemaker, I could then begin converting my questions into queries instructing Filemaker how to search through and analyze the data from different directions, breaking it down to precincts or summarizing by electoral districts or neighborhoods looking for patterns. Sometimes I started with specific questions, but lots of times I just wanted to satisfy my curiosity. Occasionally I might share some findings in a post-election blog post, but more often they just provided background understanding to guide my future reporting. And many times I would be stalled out trying to write a query that produced exactly the results I was looking for.

Then the earth moved!

This morning, I skipped the whole text file/download/import/Filemaker process and decided to see how far I could get by simply letting an AI assistant do the heavy lifting.

After downloading the plain-vanilla statewide table of precinct-by-precinct results in pdf format from the elections website, I just uploaded the 498-page data table to Claude, Anthropic’s AI assistant and the dog I chose for today’s hunt.

Claude was immediately ready to rock and roll!

I had been surprised to see how handily Congressman Ed Case had fended off what appeared to be a strong challenge from State Senator Jarrett Keohokalole, and wanted to know more about voting in their head-to-head race.

Working with Claude was seamless. I started asking questions, and Claude began returning clear, detailed answers instantly.

How many districts within Congressional District 1 did Keohokalole carry?

Claude’s answer–None.

Case ran the table, winning every one of the 25 legislative districts that make up the Congressional District 1. Claude did not include the two districts that are split between CD1 and CD2 because they didn’t fit my initial question.

And Claude provided an unexpected takeaway. The areas where Case showed the greatest strength are not where most observers might assume they would be.

Key takeaway: This is a stark geographic story.

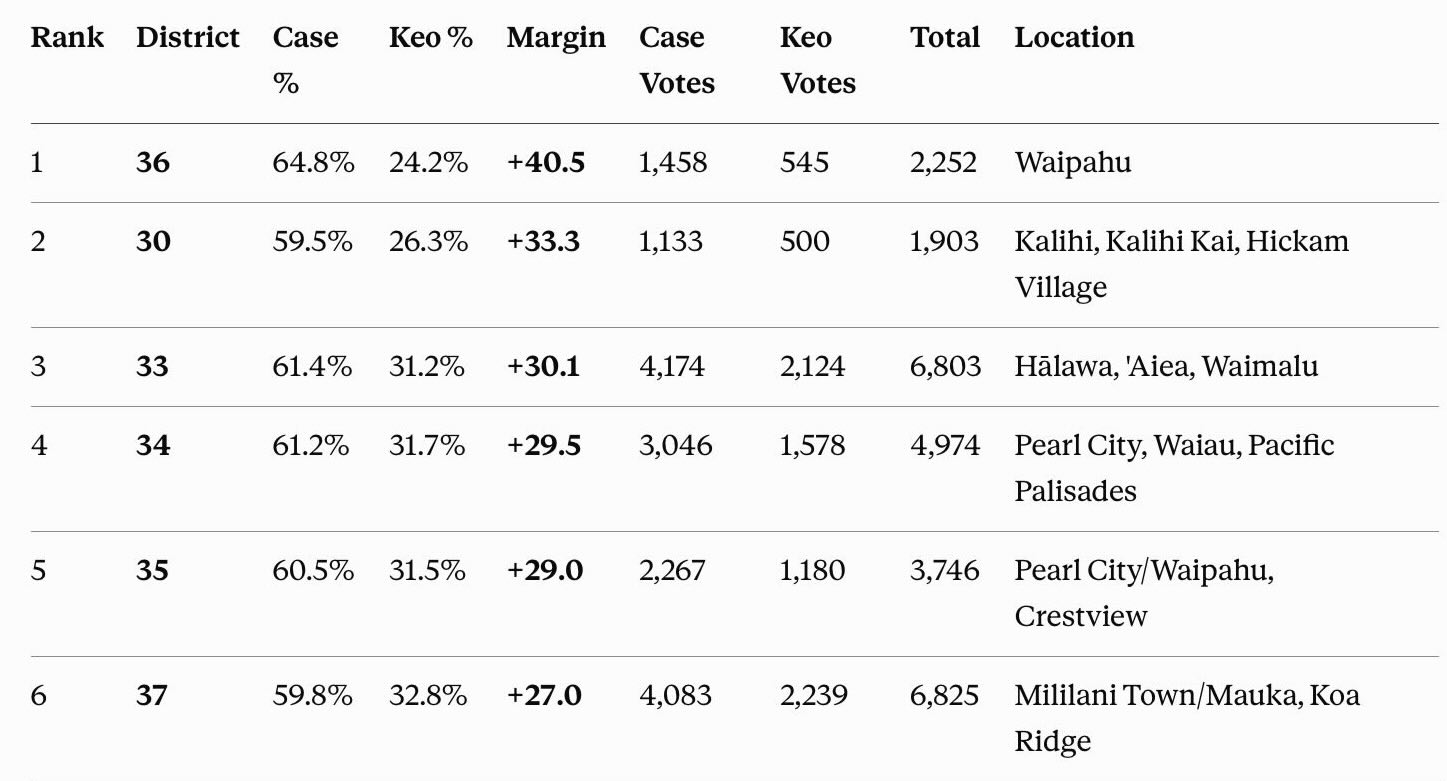
Case’s biggest margins over Keohokalole are almost entirely in Leeward and Central Oahu — Waipahu (District 36) crushed it at +40.5 points, followed by Kalihi, ‘Aiea/Halawa, Pearl City, and the Mililani corridor. These are working-class and suburban communities, not Case’s presumed home-turf advantage neighborhoods.

Notably, East Honolulu districts (18, 19, 20) — where you’d expect an incumbent’s strongest home support — only rank #9–12 on this list, with more modest margins (+16 to +20 points) despite being generally considered “Case country.” His dominance was actually strongest in the areas furthest from town.

Only 2 districts (21 and 46, not shown in top 25) had narrower margins below +8 — Case won every single House district in the congressional district, just by varying amounts.

In 1976, I doubt this geographic pattern would have been any surprise, as the leeward area at that time was considered the stronghold of the AJA-generation of Democratic Party organizers credited with the behind-the-scenes grassroots work that powered the party’s rise to political dominance. But the public perception is quite different today, making these findings somewhat startling.

Here are the districts where Case outpaced Keohokalole by the largest percentage margins. The full list can be found here.

I chose Claude for this assignment more or less at random, and I expect other AI assistants would provide more or less similar answers. That’s probably a hypothesis worth testing another day. What I keep coming back to, though, is Waipahu and Leeward Oahu. The strongest support for this four-term congressman considered to be at the more conservative end of Hawaii’s Democratic Party spectrum strongest ground wasn’t in the politically purple districts in East Honolulu — it was in the traditional Democratic Party strongholds from Pearl City to Waipahu. The progressive drift of many Democratic activists appears to carry less sway out thata way.

Twenty minutes with a PDF and an AI assistant got me to that insight almost before I’d finished my coffee. A few years ago, that would have taken me the better part of a morning, if I got there at all.

While looking for public information

I almost got hooked by a scam when looking for real property tax info for an address in Honolulu.

The city makes this public information readily available on line at no cost. Yes, free.

But I made a mistake. Instead of going directly to the city site, I was lazy and just searched for “honolulu real property tax” and then clicked on an official-looking link that appeared to be affiliated with the city. It looked different than I recalled, but I didn’t see any other immediate red flags.

It quickly got strange, though, when I entered an address. Suddenly the search, which typically takes just seconds, stretched on for at least five minutes. I wondered whether the city was suddenly using a new and very inferior vendor to provide this service.

But the biggest surprise was yet to come.

A notice of a fee for the public information. And a fee with an explanation I still find confusing and ambiguous.

PAYMENT:
$1 PER PROPERTY REPORT
REPORT BUNDLE 720 PROPERTY REPORTS

PER REPORT RATE AVAILABLE VIA REPORT BUNDLE PRICING OF $30 EVERY 30 DAYS OVER TWO YEARS NOT INDIVIDUAL SALES
WE ONLY ACCEPT VISA AND MASTERCARD FOR PAYMENT, NO ALTERNATIVE CARD TYPES ARE SUPPORTED AT THIS TIME.
GET ACCESS TO OUR PROPERTY RECORD PLATFORM WITH RECORDS FROM HAWAII FOR AN ACCESS FEE OF $1, AND 720 REPORTS FOR INSTALLMENTS OF $30 EVERY 30 DAYS FOR TWO YEARS STARTING TODAY, 24 PAYMENTS TOTAL.

ACCESS FEE TODAY: $1.00
ACCESS FEE CONNECTS YOUR ACCOUNT TO OUR PUBLIC RECORDS DATABASE
REPORT BUNDLE: PROPERTY REPORTS ARE AGGREGATED FROM PUBLIC SOURCES AND DO NOT CONSTITUTE CONSUMER REPORTS, OFFICIAL OR GOVERNMENT-AFFILIATED DOCUMENTS.
YOU CAN CLOSE YOUR ACCOUNT TO END PAYMENTS AT PUBLICRECORDSDATA.US, 1-855-601-5805, EMAIL SUPPORT@PUBLICRECORDSDATA.US, OR USE THE LIVE CHAT FEATURE. CHARGES WILL APPEAR ON YOUR STATEMENT AS PUBLICRECORDSDATA.US.
SELECT PAYMENT METHOD:
VISA
MASTERCARD

Luckily, the possibility that I might be charged $30 a month stopped me in my tracks.

So I started again at the beginning, and this time immediately found my way to the familiar site of the city’s free system.

The lesson? If you find yourself online in a place that feels weird and is asking for money, run far and run fast!!