
The recent bribery indictments that included two former powerful legislative committee chairs raised a familiar question: Who really holds the levers of power in Hawaii politics?
To find out, I turned to a massive dataset: nearly 128,000 campaign contributions made to state and local candidates across Hawaii from 2015 to 2026.
By feeding this decade of data from the Campaign Spending Commission nto ChatGPT to perform network co-giving analysis, one clear conclusion emerged:
Hawaii’s donor class doesn’t invest in ideology. They invest relationship building and institutional access.
The pattern is consistent with relationship-building and institutional access rather than strong ideological alignment.
Mapping “Portfolio Similarity”
When analyzing campaign finance, looking at who cuts checks on the exact same day is rarely where the real story lies. The strongest evidence of donor alignment comes from persistent portfolio similarity—donors who repeatedly back the same slate of viable candidates cycle after cycle.
By filtering for donors who appeared in at least ten election cycles and shared eight or more candidate selections, the AI analysis isolated a core network of 577 recurring donors connected by 1,415 strong co-giving relationships, falling into 55 distinct statistical communities.
These recurring donors generally fall into three key categories:
Small Household/Partner Circles: Near-identical small portfolios, typically representing families, partners, or close business associates.
Large Institutional Networks: PACs, registered lobbyists, and government-relations executives who give broadly to viable, winning candidates.
Cross-County Executive Networks: Individuals and organizations that repeatedly support winning county mayors across different islands.
The third category is particularly telling: the common denominator isn’t shared geography or partisan ideology—it is executive governmental authority.
The Central Donor Networks
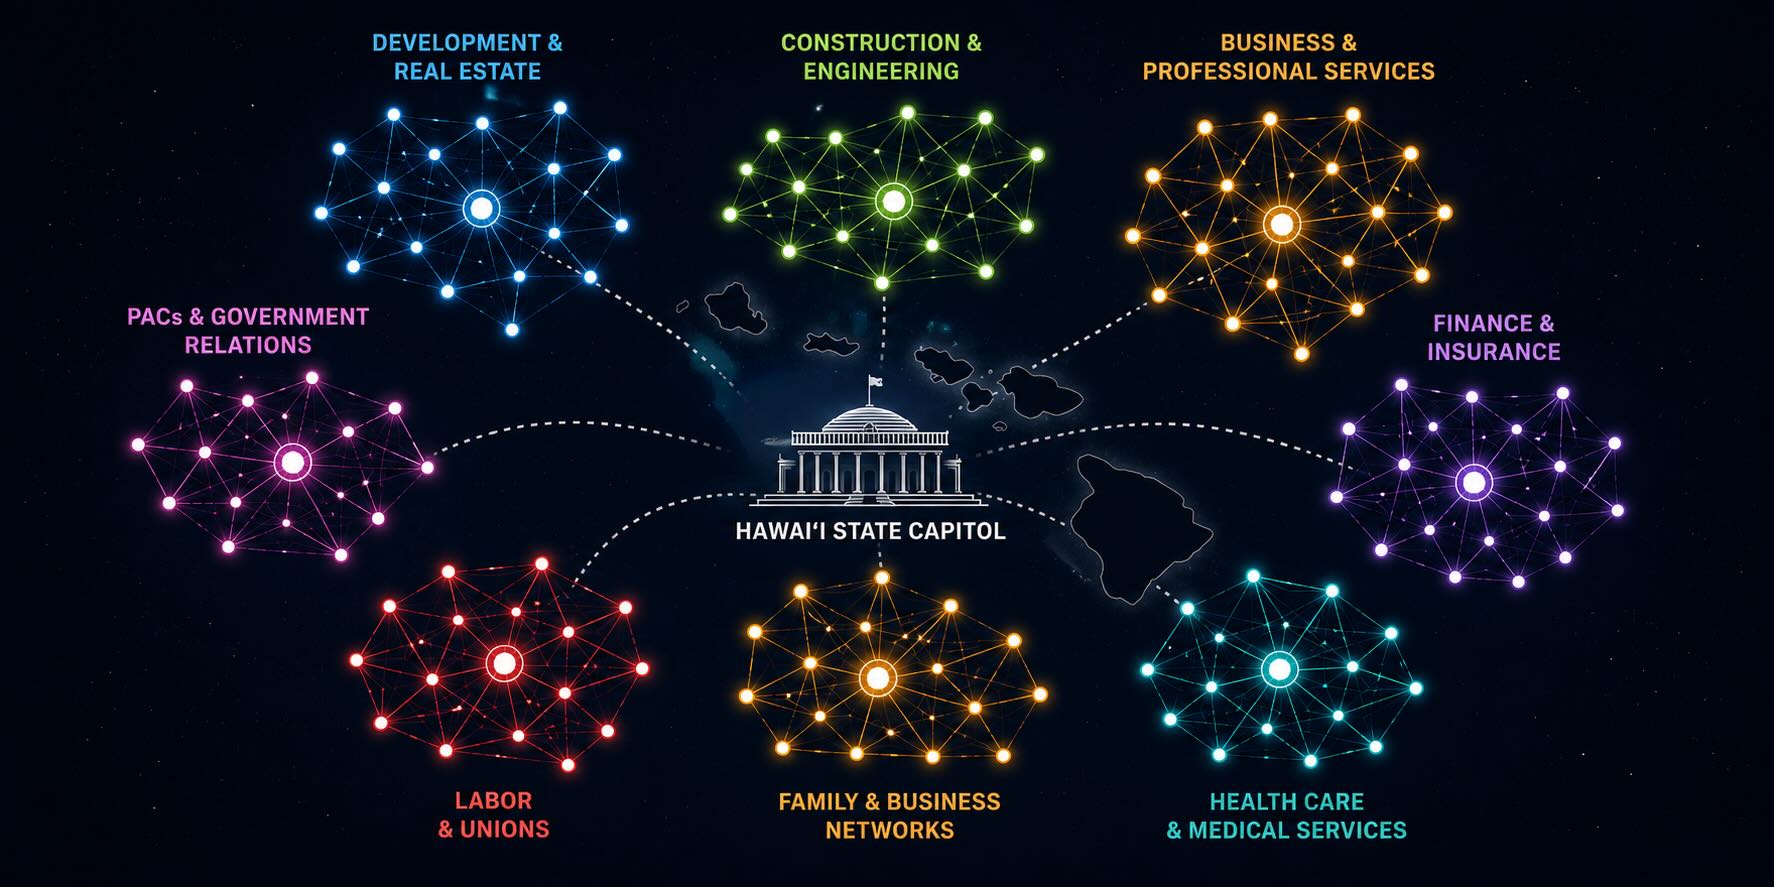
Rather than functioning in isolated industry silos, Hawaii’s donor landscape is best understood as a web of interlocking political communities.
| Donor Cluster | Core Participants & Sectors | Primary Focus & Leverage Points |
|---|---|---|
| The Institutional Core | Insurers, Utilities, Corporate PACs, Major Unions, Government Relations Firms | Access to legislative leadership, incumbent committee chairs, and regulatory policy across Democratic factions. |
| Development & Infrastructure | Engineering firms, Land-use attorneys, Contractors, Planning consultants | County-level zoning, permitting, capital improvement projects (CIP), and procurement contracts. |
| Organized Labor | Public-employee unions (HGEA, UPW), Building trades (Carpenters, Laborers, IBEW), Teachers | Incumbent relationships, department budgets, collective bargaining, and legislative leadership support. |
The Institutional Core
The most influential cluster consists of major corporate PACs, labor unions, top government relations executives, and active individual donors.
Key players in this broad access network include Island Insurance PAC, Alexander & Baldwin’s HIPAC, Local 1186 IBEW PAC, Nareit Hawaii, Hawaiian Telcom Good Government Club, Matson Navigation, HGEA, UPW, Hawaii Laborers PAC, Hawaii Regional Council of Carpenters, and General Contractors Association of Hawaii PAC. Active individuals and lobbyists appearing in this space include Bruce Coppa, Blake Oshiro, Jennifer Sabas, Ross Yamasaki, Bert Kobayashi, and Stanley Kuriyama.
Their connection isn’t necessarily about giving identical amounts on the same day—it’s about repeatedly selecting the exact same set of key decision-makers across election periods to ensure a seat at the table regardless of which faction holds power.
Development, Engineering & Professional Services
A second major cluster centers on individuals in the built environment: developers, civil engineers, land-use attorneys, and contractors.
Prominent figures in this recurring co-giving group include Patrick Kobayashi, Greg Hiyakumoto, David Tanoue, Dexter Kubota, James Yamamoto, Richard Asato, Leonard Leong, Ken Hayashida, Susan Kobayashi, and Collins Lam.
This group’s portfolio overlaps heavily around county-level governance where critical decisions on land use, infrastructure, permitting, and construction contracts are made.
Organized Labor: Overlapping, Not Monolithic
While labor unions are among the most active political donors in the state, the data shows they do not act as a single, indivisible bloc. Instead, distinct sub-networks exist—public employees (HGEA, UPW), construction trades (Laborers, Carpenters, Operating Engineers), education (HSTA), and utilities (IBEW). They converge most heavily around viable incumbents and leadership figures who control committee assignments and budget allocations.
A Note on Network Analysis & Legal Context
Co-giving patterns reflect persistent portfolio similarity—meaning these donors consistently back many of the same viable candidates over time. While this methodology identifies the institutional relationships most worth examining through public records, co-giving does not, by itself, establish improper coordination, illegal straw contributions, or undue influence.
Next Steps: Building the Full Investigative Map
Mapping campaign contribution records is just step one. To turn this donor network map into actionable investigative reporting, the next phase requires integrating six additional public datasets:
Employer Normalization: Standardizing name variations across thousands of entries (e.g., matching “A&B” with “Alexander & Baldwin”).
Corporate & Non-Profit Boards: Cross-referencing top donor clusters against DCCA corporate filings and IRS Form 990 board rosters.
Government Boards & Commissions: Overlaying recurring donor lists against state and county board appointments (e.g., Land Use Commission, HART, Planning Commissions).
Lobbying & Procurement: Matching contribution timing against registered lobbying clients, government contracts, and contested land-use proceedings.
By layering these datasets, we can move from simple campaign finance tallies to a clear, multidimensional map of how institutional influence operates across Hawaii.
But whether these data are available in a form that can be accessed for such an analysis remains to be seen.
Have a specific donor cluster, contractor, or board you’d like to see analyzed in the next phase? Leave a comment below or drop a tip.
[Original post revised at 6:33 a.m. with assistance from ChatGPT and Gemini.]
Discover more from i L i n d
Subscribe to get the latest posts sent to your email.
This is a phenomenal, far- reaching data set… I waswondering if the travel and tourism exec group is hidden somewhere and referenced by a different moniker. They wield a tremendous amount of influence statewide and draw huge amounts of built-in funding from the legislature. But maybe I’m missing the obvious…
Awesome, mind- boggling work, Ian.
I do hope you’re feeling better.
The body is a little beat up, but the brain is certainly tack sharp. This kind of posting highlights the skill it takes to be a true investigative reporter…comprehensive work that illustrates how new tech is a tool for citizen use to check on how are gvmnt is working for us.
How does money into media correspond to campaign spending, might be an interesting check.
It would be useful to know how much labor unions and other groups would have to pay in real property taxes if they didn’t have an exemption. For example, the carpenter’s union would have to pay about $60,000 if they didn’t have the “charitable organization” exemption. (They currently pay $300/year for their Houghtailing property.)
Can those additional public datasets be integrated using AI?
AI supposedly knows everything, right?
I’m curious to hear your thoughts on if there are any similarities to what Robert Caro wrote about in the Power Broker? That may be a case of one man and political influence, but perhaps there are similarities between the mechanisms that Bob Moses used to build momentum and standardize the flow of public funding to contractors and companies?