Category Archives: Housing

My parents bought their property in Kahala for $5,900

In late 1942, my dad signed a contract and paid a $100 downpayment to purchase a new 3-bedroom house on a lot in Kahala. The back yard flowed over into one of the famrs that filled most of the interior of Kahala at that time. Among those living along Kealaolu Avenue were war workers and hookers. The offer to pay $6,000 for the small 3-bedroom house on a 11,250 square foot leasehold lot was accepted. By the time the deal closed, $100 had been knocked off the price because of what my dad said was a scratch on the floor.

Here’s a copy of the original real estate contract.

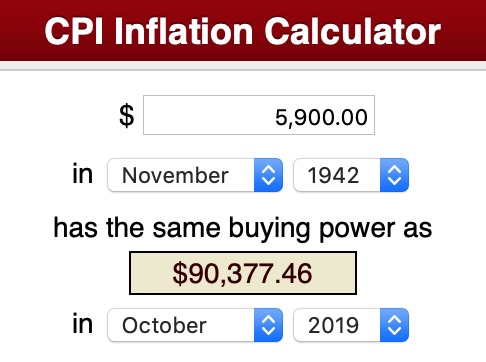
When I ran into this receipt, I wondered what that $5,900 would be worth in today’s dollars. I turned to the Consumer Price Index Calculator available from the Bureau of Labor Statistics.

It came up with the answer: It would be equal to $90,377.46 in today’s dollars.

Is there anything remotely comparable that you could buy today for $90,000? Short answer–No. Nothing close.

To be fair, the area wasn’t considered that desirable in 1942. It was just a normal neighborhood backed up to neighboring farms. But it had bus service, was relatively close to shopping, and close to the beach. And by today’s standards, it’s considered a large lot.

How did it that 1942 price tag compare to the cost of the first apartment we bought back in 1978?

The original $5,900 would have been worth about $22,651.79 in 1978, according to the CPI calculator. We had to pay 2-1/2 times that for a 2-bedroom townhouse near Kahala Mall. So housing had gotten more expensive, but was not totally out of reach.

Today is another story. You can still buy raw land in the boondocks for under $90,000 but not with a house, unless it’s on leasehold land with exorbitant lease rent.

It’s just a small example of how fast we’re moving away from the concept of affordability.

Checking that credit score

Here’s a little bit of consumer info that surprised me.

I got an email reminder that our Costco VISA card issued by Citi Bank includes monthly access to our FICO credit score. I thought it might be interesting to check it out, so I clicked through to see what I could learn.

We have always been financially conservative, and have assumed that if you didn’t carry a lot of debt, and paid off your bills every month on time, you would be considered a fine credit risk.

But now I learn that it might actually hurt our credit score.

It’s not that our credit score was bad, but according to City Bank, it was “impacted”–I presume they mean it was lower than it otherwise would have been–by two factors.

But both of these apparently negative factors are things that seem positive to me in my apparently naive “avoid debt-pay bills” approach to financial life.

First “key factor” reported–They say we don’t have enough “non-mortgage installment” debt, “such as auto or student loans.” Apparently if you don’t have enough consumer debt, they can’t quantify how well you manage your debt.

Well, that’s true. We try to pay our bills off as they are due, rather than accumulating debt. But it seems puzzling that this would result in a lower credit rating.

The second negative factor also caught me by surprise. Our credit cards and other monthly balances, like for broadband, telephone, and similar services, are paid off automatically each month on or before the due dates.

According to the notice, our score “was impacted by having too many accounts with balances,” even though they were all paid off on time, and always have been.

Live and learn, I guess.

Homeless is a national problem, needs a national response

Watching and reading news from other parts of the country, I’m reminded that homelessness is something we are grappling with at the local level, but it is really a national problem with national roots. How else do you explain that the same thing is repeated in city after city across this country?

And if it’s a national problem, it is something that is going to take national resources to address in more than band aid fashion.

The roots? Here are two suggestions.

• The dramatic rise in economic inequality and the hollowing out of the middle class since the 1960s.

• The impact of Reaganism and the decline in federal funding for mental health services and other “social safety net” services over the past four decades.

The decline in available community mental health services in Hawaii contributes not only to homelessness but also to the costs of imprisonment.

More communities are realizing that homelessness is a form of emergency that needs an emergency response. Now Congress has to get the message that local communities need federal resources they would be eligible for if this were a natural disaster like a hurricane or tsunami.

See: You can easily find lots of examples in recent news stories, but here are a few.

What Don’t We Understand About Homelessness in Portland?

Searching the stories of the homeless for meaning and understanding about how it happens

“State of Emergency”: Special Report on California’s Criminalization of Growing Homeless Encampments

Historical statistics of Hawaii

I have a simple recommendation. If you ever find yourself wondering what Hawaii was like in the “old” days and how it changed over time, an extremely useful reference is Robert Schmidt’s “Historical Statistics of Hawaii.”

Schmidt compiled the book when he was serving at state statistician. The book has 26 chapters covering different aspects of the community and economy, each with an introduction that surveys the history of the collection of data on that particular subject. It’s really a treasure trove of fascinating bits and pieces of history, although you’ll have to get comfortable looking at data presented in table form.

This is a huge printed book, running nearly 700 oversize pages. I once found a used copy in a thrift shop, and used hardcover copies can be found for about $25 from Amazon or the independent bookstores that sell via Alibris.com.

This weekend I was looking for data to illustrate the changes in post-WWII Hawaii. I ended up using data showing how the population shifted from rural to urban areas from the 1800s through to the late 1960s, and showed how the number of private cars doubled between 1945 and 1950, and then doubled again by 1962. Another chart that I used traced the changes in retail sales as both downtown Honolulu and small mom & pop stores were overtaken and overshadowed by Ala Moana Center, Kahala Mall, and other regional malls during the 1950s and 1960s.

In any case, an extremely useful and interesting resources.

But here’s the big hint. It’s also available for free as a 22MB pdf file from the Department of Business, Economic Development, and Tourism.

I’ve downloaded a copy and filed it for quick future reference.

You might want to do the same.